Search Again
We support boolean queries, use +,-,<,>,~,* to alter the weighting of terms
Canvas X
Illustration and communication software for engineers and technical graphics professionals that combines the ability to make 3D images while also applying filters and duatone images. The software has minimum precision levels and object illustration and image editing tools to keep data accurate throughout the authoring process. Users can accelerate and streamline the technical illustration workflow from initial import and design to final presentation, facilitate collaboration, and improve the overall productivity. Tutorials and technical documents are available on the website.
- Resource
- SciCrunch
- 11 years ago - submitted by Jessica Cabotaje
ImageScope
Slide image modification software that allows the user to adjust the magnification, compare slides, pan and zoom, annotate specific areas, and perform image analysis of digital slides. Users can create macros and algorithms to automate analysis and create plots, respectively., THIS RESOURCE IS NO LONGER IN SERVICE. Documented on September 16,2025.
- Resource
- SciCrunch
- 11 years ago - submitted by Gabrielle Pine
InfoStat
A general stastical software for Windows which can perform basic statistical analysis, statistical modeling, multivariate analysis, and produce of graphs. InfoStat also has facilities that could be useful in teaching statistics. It can connect to R through the interpreter, which can run R scripts without leaving the InfoStat working environment, and through the implemented menu-driven procedures, which make use of the R calculation engine.
- Resource
- SciCrunch
- 11 years ago - submitted by Gabrielle Pine
Clocklab
Point and click program used to quickly analyse circadian activity data using algorithms and embedded controls to make every graph interactive and useful for data analysis. The analysis program has been used for a variety of species including mice, hamsters, rats, sheep, Drosophila, and humans. This program has three separate applications: one for data collection, one for analysis, and a chamber control program.
- Resource
- SciCrunch
- 11 years ago - submitted by Gabrielle Pine
TurboReg
An ImageJ plugin for the automatic alignment of a source image (or a stack) to a target image. Manual, automatic, and batch alignment modes are available. Users may specify some landmarks to establish the initial correspondence between images. In automatic and batch modes, the landmarks are automatically refined to match the landmarks of the target image. After registration, the plugin creates a warped image using the final position of the source image and the target landmarks. The plugin can be called by a macro or by another plugin. Technical guidance is available on the website.
- Resource
- SciCrunch
- 11 years ago - by Anonymous
ScanImage
Open source software application for laser scanning microscopy, electrophysiology, laser scanning photostimulation, and other physiological methods focused on neurobiology. Used to control laser scanning microscopes without need for custom data acquisition hardware. Standard data acquisition boards are used to acquire data and control laser scanning. The tasks of signal integration and image processing are placed on the computer CPU. Multiple versions of ScanImage are available, each with their own features.
- Resource
- SciCrunch
- 11 years ago - by Anonymous
Human Brain Project Cell Morphology
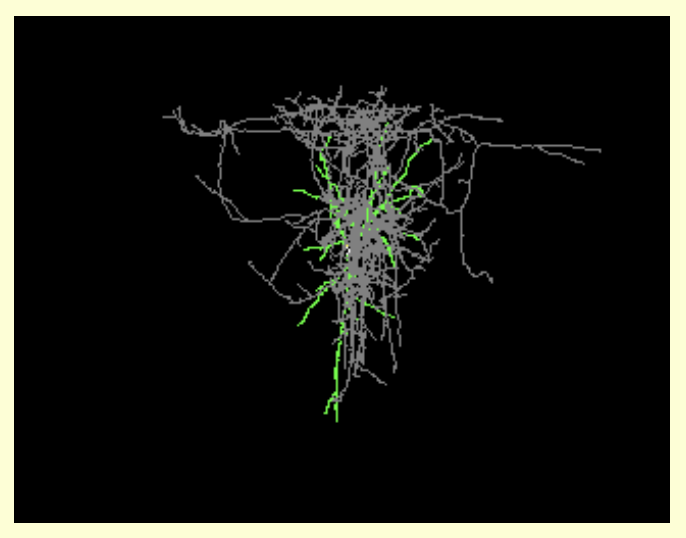
Data set about mapping information provided as text files. The text files contain 3D representations of neuronal morphologies reconstructed using Neurolucida.
- Resource
- SciCrunch
- 11 years ago - by Anonymous
Amira 3D analysis
Software tool for visualizing, manipulating, and understanding data from tomography, microscopy, MRI and other imaging processes.Used to import and export options, to processes 3D image filtering and DTI based fiber tracking to visualization, volume and surface rendering, author tools for virtual reality navigation, video generation, and more.
- Resource
- SciCrunch
- 11 years ago - submitted by Gabrielle Pine
ResearchIQ
THIS RESOURCE IS NO LONGER IN SERVICE, documented March 14, 2016. Research Integrative Query (ResearchIQ) tool, a semantically anchored resource discovery platform that facilitates semantic discovery of local and publicly available data through a single web portal designed for researchers in the biomedical informatics domain within The Ohio State University.
- Resource
- SciCrunch
- 11 years ago - submitted by Anita Bandrowski
FluoRender
Interactive rendering tool for confocal microscopy data visualization. Combines rendering of multi-channel volume data and polygon mesh data, where properties of each dataset can be adjusted independently and quickly. Designed for neurobiologists, allowing them to better visualize confocal data from fluorescently-stained brains, but it is also useful for other biological samples. Features include feature tracking, 3D measurement tools, multiple render modes for multi-channel confocal data, and volume paint selection and segmentation.
- Resource
- SciCrunch
- 11 years ago - submitted by Jessica Cabotaje
Janelia Workstation
A discovery platform used to analyze and annotate imagery for individual projects, while assembling shared data resources. It was originally applied to Drosophila neuronal anatomy and neuroblast lineage analysis and is currently being extended to support mouse whole-brain projection tracing. The Workstation is both a pipeline management system that extracts entities from 3D imagery and a suite of tools that enable scientists to annotate large imagery datasets. A Entity-Attribute-Value (EAV) graph permits any element to be annotated by users with custom ontologies. By allowing any entity to have multiple parents, the graph can be re-arranged by each user without copying the underlying image data.
- Resource
- SciCrunch
- 11 years ago - submitted by Jessica Cabotaje
NiftyFit
Software package for multi-parametric model-fitting of 4D Magnetic Resonance Imaging data. Software library to facilitate voxel wise fitting on a number of datatypes including T1 and T2 relaxometry, Arterial Spin Labeled MRI, Diffusion Weighted Imaging and Dynamic Contrast Enhanced MRI. T
- Resource
- SciCrunch
- 11 years ago - submitted by David Kennedy
SlideBook
Digital microscopy software for research microscopy. It comes standard with drivers to control numerous instruments in and around the microscope. When online, data is acquired in a native-3D format over time, color and specimen locations in customizable experiment protocols. Data can be analyzed by a wide variety of tools for image processing including mathematical operations, statistics functions, analysis scripting and import to/export from MATLAB. Additional modules are available for special applications ranging from deconvolution to photomanipulation to multiphoton.
- Resource
- SciCrunch
- 11 years ago - submitted by Jessica Cabotaje
Multi Gauge
A software application for one-dimensional electrophoretic analysis of multi-labeled fluorophores. It was designed to analyze multi-channel fluorescence data from Fujifilm FLA-5000 and FLA-8000 scanning systems. The software also works with other scanners in the BAS/FLA series and with the LAS series.
- Resource
- SciCrunch
- 11 years ago - submitted by Jessica Cabotaje
Adobe Photoshop CS4
Image processing and analysis software.
- Resource
- SciCrunch
- 11 years ago - by Anonymous
FEI
THIS RESOURCE IS NO LONGER IN SERVICE. Documented on June 1, 2023. Software used for a variety of functions including image automation frameworks and advanced 3D data quantification, and simulation technologies.
- Resource
- SciCrunch
- 11 years ago - by Anonymous
MED Associates Activity Monitor software
Software designed to record and organize data. All experiments and subject data are entered into a database, with all subject data linked together allowing the software to track everything, and save it based on the assigned Subject ID. All standard data is displayed in real time along with a cumulative plot of the subject’s activity for all chambers. Users may choose the specific chamber size allowing for distance traveled to be measured in real units instead of beams broken. A rotational analysis option allows examination of large or small rotations, allowing for rotational measures to be obtained on staggering, ataxic, lesioned, or other loco-motor impaired mice or rats. Zonal analysis allows the user to change boundaries around the animal in post analysis. Up to eight systems can be connected to one computer.
- Resource
- SciCrunch
- 11 years ago - submitted by Gabrielle Pine
Transfer Entropy Toolbox
A suite of MATLAB/C and C++ tools for computing standard and extended versions of transfer entropy (as recorded by Thomas Schreiber) on sparse, binary time series. Delay 1, delayed, and higher-order transfer entropy are available in the toolbox. The speed of the program is dependent upon the number of delays, the length of the data set, the number of neurons, and the message length/order. Documentation and examples are provided on the website.
- Resource
- SciCrunch
- 11 years ago - submitted by Jessica Cabotaje
MetaFluor Fluorescence Ratio Imaging Software
Software designed for single or multi-wavelength intracellular ion measurements. It provides simultaneous display of raw data, ratio image, graphs of intensities, ratios, ion concentrations, and a non-ratiometric image such as a brightfield or phase-contrast image. Two different ratiometric indicators can be imaged and measured simultaneously to provide greater insight to ion exchange and intracellular function regardless of dye loading concentrations, conditions, or emission intensities.
- Resource
- SciCrunch
- 11 years ago - submitted by Jessica Cabotaje
SAP Visual Enterprise Author
A desktop application used to create and manage 2D and 3D animation and video and audio assets. SAP Visual Enterprise Author can be used to render visual content into common desktop documents, file formats, and business applications for secure downstream use. A variety of tools allows users to view, transform, optimize, animate, and publish in different formats.
- Resource
- SciCrunch
- 11 years ago - submitted by Jessica Cabotaje
About
The SciCrunch Infrastructure was developed as a cooperative data platform to be used by diverse communities in making data more FAIR.
Contact Us
 scicrunch.org