Search Again
We support boolean queries, use +,-,<,>,~,* to alter the weighting of terms
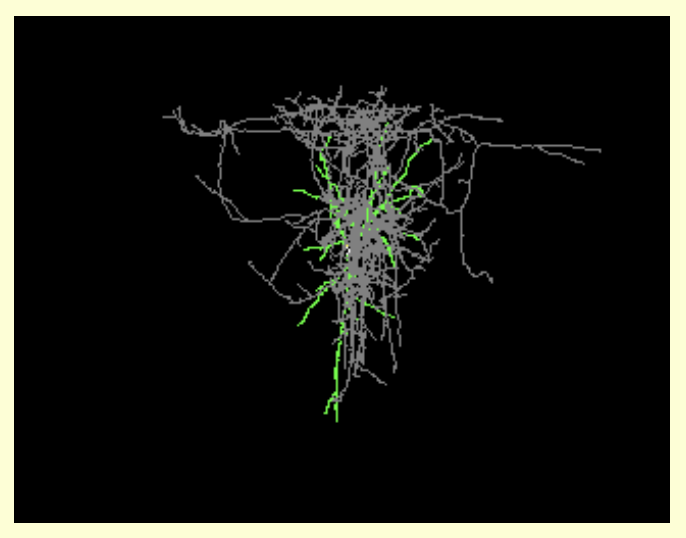
Allen Cell Types Database
Database of neuronal cell types based on multimodal characterization of single cells to enable data-driven approaches to classification.
- Resource
- RRID-Legacy
- 9 years ago - by Anonymous
Rare and Atypical Diabetes Network
Portal dedicated to characterizing, discovering and defining rare and atypical forms of diabetes. Network of universities, hospitals and clinics across the United States dedicated to better understanding atypical diabetes. Team of academic institutions and scientists collaborates with physicians and healthcare groups to identify those with atypical diabetes and learn more about their health.
- Resource
- RRID
- 3 years ago - submitted by Edyta Vieth
GenePaint P7 Atlas
Abbreviated reference atlas for the P56 mouse. All sections were nissl stained and digitized. To assist in the initial identification of sites of gene expression sites, maps of brains are available for E15.5, P7 and the adult. These maps depict the boundaries of major brain regions (cortex, thalamus, striatum, globus pallidus, ventral striatum, septum, basal forebrain, hippocampus, midbrain, pons, medulla, cerebellum) and also show the more prominent nerve tracts. Maps are most efficiently used by placing the window depicting the map of interest next to the gene expression image. Browsing between planes of sectioning is permitted thus allowing the most appropriate plane to be selected. The annotation of anatomical details such as brain nuclei is currently beyond the scope of the GenePaint database. Hence, such information on the anatomy of the brain and embryo should be obtained from published atlases of mouse anatomy (Kaufman, 1995; Paxinos and Franklin, 2001; Jacobowitz and Abbott, 1997; Schambra et al., 1992; Valverde1998).
- Resource
- SciCrunch
- 17 years ago - by Anonymous
GrowthToolbox
Analysis software for analysis of finite elements and simulations of 3D shape changes in a tissue that result from patterns of growth. It works with Matlab to model biological growth of leaves, petals, and similar organs.
- Resource
- RRID-Legacy
- 9 years ago - by Anonymous
Van Andel Institute Bioinformatics and Biostatistics Core Facility
Core provides bioinformatics and statistics expertise. Core develops and maintains automated and customizable workflows for processing and analyzing many types of genomic data; supports design of rigorous, robust and reproducible experiments and proposals; assists in preparation of manuscripts, grants and presentations; and provides education and training in use of software and analysis methods.Core can contribute to many types of bioinformatics or statistical projects.
- Resource
- SciCrunch
- 3 years ago - submitted by Edyta Vieth
Gramene
Curated, open-source, integrated data resource for comparative functional genomics in crops and model plant species to facilitate the study of cross-species comparisons using information generated from projects supported by public funds. It currently hosts annotated whole genomes in over two dozen plant species and partial assemblies for almost a dozen wild rice species in the Ensembl browser, genetic and physical maps with genes, ESTs and QTLs locations, genetic diversity data sets, structure-function analysis of proteins, plant pathways databases (BioCyc and Plant Reactome platforms), and descriptions of phenotypic traits and mutations. The web-based displays for phenotypes include the Genes and Quantitative Trait Loci (QTL) modules. Sequence based relationships are displayed in the Genomes module using the genome browser adapted from Ensembl, in the Maps module using the comparative map viewer (CMap) from GMOD, and in the Proteins module displays. BLAST is used to search for similar sequences. Literature supporting all the above data is organized in the Literature database. In addition, Gramene now hosts a variety of web services including a Distributed Annotation Server (DAS), BLAST and a public MySQL database. Twice a year, Gramene releases a major build of the database and makes interim releases to correct errors or to make important updates to software and/or data. Additionally you can access Gramene through an FTP site.
- Resource
- SciCrunch
- 17 years ago - by Anonymous
Flowing Software 2.5.1
Software for flow cytometry data analysis. Flowing Software has many common analysis tools, such as dot plots, histograms, quadrants, statistics, overlay histograms etc.
- Resource
- SciCrunch
- 9 years ago - submitted by Maria del Mar Ortega-villaizan
University of Manchester National X-ray Computed Tomography Core Facility
Provides access and expert support to run cutting-edge 3D and 3D time-lapse imaging experiments.Provides access to X-ray instruments, technical support for new and existing users, expertise to design complex experiments, infrastructure and resources to analyse 3D and 4D data.Funded by the Engineering and Physical Sciences Research Council (EPSRC).
- Resource
- SciCrunch
- 3 years ago - submitted by Edyta Vieth
OBD-PKB Interface
THIS RESOURCE IS NO LONGER IN SERVICE, documented August 23, 2016. This interface is for exploring data collected as part of the NIF Neurodegenerative Disease Ontology project. Not generally intended for public consumption yet, but people are welcome to look - large caveat emptor applies. Sponsors: This resource is part of the NIF project.
- Resource
- SciCrunch
- 17 years ago - by Anonymous
Clinical Trials in Organ Transplantation in Children (CTOT-C)
Project portal for a cooperative research program sponsored by the National Institute of Allergy and Infectious Diseases (NIAID). CTOT-C is an investigative consortium for conducting clinical and associated mechanistic studies that will lead to improved outcomes for pediatric heart, lung, or kidney transplant recipients.
- Resource
- dkNET
- 9 years ago - submitted by Ko-Wei Lin
Creighton University Drug Discovery and Delivery Core Facility
Core subcores include Drug Design, Synthesis and Validation Laboratory, ADMETox Laboratory,Zebrafish Laboratory. Offers experts and technologies to provide services tailored to drug development needs. Can assist with drug screening and design from small molecules to peptides, development and applying methodologies to synthesize drug candidate, and validate its chemical structure and purity. Offers services to detect and quantify drugs in biological samples. Follow-up studies can be conducted using services of ADMETox subcore to characterize drug candidate toxicity, efficacy, and pharmacokinetic and pharmacodynamic profiles, and assist in developing appropriate formulation and delivery approaches.
- Resource
- SciCrunch
- 3 years ago - submitted by Edyta Vieth
Neal's DNA Mutation Site
This site provides access to mutation databases and software including the human hprt database, Human p53 database, Transgenic lacZ database, and Transgenic lacI database. Other avaialble programs include Mutational spectra comparison and relational database data entry. The most recent hprt database contains information on over 2,300 mutations found in vivo and in vitro in the human hprt gene and runs under Windows. The version for evaluation on this homepage has fewer mutations and is a DOS program. The database contains information on the mutagen, dose, spontaneous and induced mutant fraction, base position, amino acid position, amino acid change, local DNA sequence, cell type, citation, and other items. In addition, information regarding the cause and effect of mutations affecting splicing is given. Routines have been developed for the analysis of single base substitutions. The p53 database contains information on nearly 5,867 mutations found in the human p53 gene. The database itself has been updated in April of 1997. The database contains information on the cancer type, loss of heterozygosity, base position, amino acid position, amino acid change, local DNA sequence,citation, and other items. Routines have been developed for the analysis of single base substitutions. The Transgenic lacZ database contains information on 405 mutations found in vivo in the transgenic lacZ gene. It has last been updated in January of 1998. It provides information on the mutagen, dose, organ, mutant fraction, base position, amino acid position, amino acid change, local DNA sequence, citation, and other items. The Transgenic lacI database contains information on over 1700 mutations found in vivo in the transgenic lacI gene and on nearly 8000 mutations in the lacI gene in native E. coli. The database was updated in January 1998. The database contains information on the mutagen, dose, organ, mutant fraction, base position, amino acid position, amino acid change, local DNA sequence, citation, and other items. Routines have been developed for the analysis of single base substitutions for each of the databases. The software runs only on IBM-compatible PCs.
- Resource
- SciCrunch
- 15 years ago - by Anonymous
National Glycohemoglobin Standardization Program
Project that aims to standardize Hemoglobin A1c test results to those of the Diabetes Control and Complications Trial (DCCT) and United Kingdom Prospective Diabetes Study (UKPDS) which established the direct relationships between HbA1c levels and outcome risks in patients with diabetes.
- Resource
- dkNET
- 9 years ago - submitted by Ko-Wei Lin
ggfortify
Software tool as unified interface to visualize statistical results of popular R packages. Provides unified interface that enables users to use one line of code to visualize statistical results of many R packages using ggplot2 idioms. Allows ggplot2 to handle some popular R packages.
- Resource
- RRID
- 3 years ago - by Anonymous
BioMart Project
THIS RESOURCE IS NO LONGER IN SERVICE. Documented on January 4,2023.Platform provides free software and data services to international scientific community in order to foster scientific collaboration and facilitate scientific discovery process. Project adheres to open source philosophy that promotes collaboration and code reuse.
- Resource
- SciCrunch
- 17 years ago - by Anonymous
Emory Epithelial Pathobiology Research Development Center
THIS RESOURCE IS NO LONGER IN SERVICE. Documented on July 5th,2023. Center for pathobiology research development.
- Resource
- SciCrunch
- 9 years ago - submitted by Isabella Froman
FSLeyes
Web application as FSL image viewer for visualising neuroimaging data.
- Resource
- RRID
- 3 years ago - submitted by Edyta Vieth
MicroArray and Gene Expression Markup Language
A language / data exchange format designed to describe and communicate information about microarray based experiments that is based on XML and can describe microarray designs, microarray manufacturing information, microarray experiment setup and execution information, gene expression data and data analysis results. MAGE-ML has been automatically derived from Microarray Gene Expression Object Model (MAGE-OM), which is developed and described using the Unified Modelling Language (UML) -- a standard language for describing object models. Descriptions using UML have an advantage over direct XML document type definitions (DTDs), in many respects. First they use graphical representation depicting the relationships between different entities in a way which is much easier to follow than DTDs. Second, the UML diagrams are primarily meant for humans, while DTDs are meant for computers. Therefore MAGE-OM should be considered as the primary model, and MAGE-ML will be explained by providing simplified fragments of MAGE-OM, rather then XML DTD or XML Schema. (from the description by Ugis Sarkans) The field of gene expression experiments has several distinct technologies that a standard must include. These include single vs. dual channel experiments, cDNA vs. oligonucleotides. Because of these different technologies and different types of gene expression experiments, it is not expected that all aspects of the standard will be used by all organizations. Given the massive amount of data associated with a single set of experiments, it is felt that Extensible Markup Language (XML) is the best way to describe the data. The use of a Document Type Definition (DTD) allows a well-defined tag set, a vocabulary, to describe the domain of gene expression experiments. It also has the virtue of compressing very well so that files in an XML format compress to ten percent of their original size. XML is now widely accepted as a data exchange format across multiple platforms.
- Resource
- SciCrunch
- 17 years ago - by Anonymous
MRTool
Software toolkit for analysis of MR brain imaging data. MRTool runs on Apple computers and PCs and requires SPM12.
- RRID-Legacy
- 9 years ago - submitted by David Kennedy
Stanford Geomicrobiology Shared Laboratories Core Facility
Geomicrobiology analytical facilities consist of four different labs in the Green Earth Sciences Building. Main areas of study are: molecular, bio(geo)chemical, and ecological aspects of microbial cycling of nitrogen, carbon, and metals in environment diversity, distribution, and activity of microorganisms driving greenhouse gas cycling in ocean and beyond molecular biomarkers in modern organisms to refine our interpretations of microbial fossil record.
- Resource
- SciCrunch
- 2 years ago - by Anonymous
About
The SciCrunch Infrastructure was developed as a cooperative data platform to be used by diverse communities in making data more FAIR.


Contact Us
 scicrunch.org