Search Again
We support boolean queries, use +,-,<,>,~,* to alter the weighting of terms
rMAT
Software package for normalizing and analyzing tiling arrays and ChIP-chip data. It is the R-version of a MAT program.
- Resource
- SciCrunch
- 13 years ago - by Anonymous
Bern-Barcelona EEG database
THIS RESOURCE IS NO LONGER IN SERVICE, documented November 23, 2020; EEG data set, source code, and results from 7500 signal pairs from 5 epilepsy patients analyzed in the manuscript, Andrzejak RG, Schindler K, Rummel C. Nonrandomness, nonlinear dependence, and nonstationarity of electroencephalographic recordings from epilepsy patients. Phys. Rev. E, 86, 046206, 2012. All Matlab source codes are included in the file ASR_Sources_2012_10_16.zip. The clinical purpose of these recordings was to delineate the brain areas to be surgically removed in each individual patient in order to achieve seizure control.
- Resource
- SciCrunch
- 14 years ago - by Anonymous
EEG Database
Data set from a large study to examine EEG correlates of genetic predisposition to alcoholism. It contains measurements from 64 electrodes placed on the scalp sampled at 256 Hz (3.9-msec epoch) for 1 second. There were two groups of subjects: alcoholic and control. Each subject was exposed to either a single stimulus (S1) or to two stimuli (S1 and S2) which were pictures of objects chosen from the 1980 Snodgrass and Vanderwart picture set. When two stimuli were shown, they were presented in either a matched condition where S1 was identical to S2 or in a non-matched condition where S1 differed from S2. There were 122 subjects and each subject completed 120 trials where different stimuli were shown. The electrode positions were located at standard sites (Standard Electrode Position Nomenclature, American Electroencephalographic Association 1990). Zhang et al. (1995) describes in detail the data collection process. There are three versions of the EEG data set. * The Small Data Set (smni97_eeg_data.tar.gz) contains data for the 2 subjects, alcoholic a_co2a0000364 and control c_co2c0000337. For each of the 3 matching paradigms, c_1 (one presentation only), c_m (match to previous presentation) and c_n (no-match to previous presentation), 10 runs are shown. * The Large Data Set (SMNI_CMI_TRAIN.tar.gz and SMNI_CMI_TEST.tar.gz) contains data for 10 alcoholic and 10 control subjects, with 10 runs per subject per paradigm. The test data used the same 10 alcoholic and 10 control subjects as with the training data, but with 10 out-of-sample runs per subject per paradigm. * The Full Data Set contains all 120 trials for 122 subjects. The entire set of data is about 700 MBytes.
- Resource
- SciCrunch
- 14 years ago - by Anonymous
Rodrigo Quian Quiroga EEG ERP and single cell recordings database
5 EEG, ERP and single cell recordings data sets where each file corresponds to the recording on a different subject in the left occipital electrode (O1), with linked earlobes reference. Each file contains several artifact-free trials, each of them containing 512 data points (256 pre- and 256 post-stimulation) stored with a sampling frequency of 250 Hz. Trials are stored consecutively in a 1 column file. Data was pre-filtered in the range 0.1-70Hz. All trials correspond to target stimulation with an oddball paradigm. STAR R based Data Sets Used * Dataset # 1: Human single-cell recording * Dataset # 2: Simulated extracellular recordings * Dataset # 3: EEG signals from rats * Dataset # 4: Pattern visual evoked potentials. * Dataset # 5: Tonic-clonic (Grand Mal) seizures.
- Resource
- SciCrunch
- 14 years ago - by Anonymous
EEG time series Data Sets
Five data sets containing quasi-stationary, artifact-free EEG signals both in normal subjects and epileptic patients were put in the web by Ralph Andrzejak from the Epilepsy center in Bonn, Germany. Each data set contains 100 single channel EEG segments of 23.6 sec duration.
- Resource
- SciCrunch
- 14 years ago - by Anonymous
CGHcall
Software that calls aberrations for array CGH data using a six state mixture model and several biological concepts. It is written in R.
- Resource
- SciCrunch
- 13 years ago - by Anonymous
Neural Cipher
THIS RESOURCE IS NO LONGER IN SERVICE, documented August 17, 2016. C#.NET 4.0 application that interfaces with the Neural Maestro class library to perform Classical and Bayesian logistic polynomial regression analysis for multiple trial and experimental neuroscience / electrophysiological datasets. The idea is to build a neural feature extractor to plug into a neural recognition network based on recordings from patch clamps and/or brain computer interfaces. Frequency based feature sets are collected from the simulation of neuronal cell assemblies and examined for inclusion in combinatorial regressions using the Neural Maestro API. Regressions are evaluated based on different metrics. The application interfaces with a R and MATLAB API and produces a compendium to be published on CRAN.
- Resource
- SciCrunch
- 14 years ago - by Anonymous
Benaroya Research Institute: Neurological Diseases
BRI investigators study the molecular and genetic mechanisms which underlie some of the most devastating chronic neurological disorders, and conduct clinical trials for new innovative therapies. Neurological studies that are currently studied include Amyotrophic lateral sclerosis (ALS) or Lou Gehrig's Disease, Multiple Sclerosis, and Parkinson's Disease.
- Resource
- SciCrunch
- 17 years ago - by Anonymous
Enrichr
A web-based gene list enrichment analysis tool that provides various types of visualization summaries of collective functions of gene lists. It includes new gene-set libraries, an alternative approach to rank enriched terms, and various interactive visualization approaches to display enrichment results using the JavaScript library, Data Driven Documents (D3). The software can also be embedded into any tool that performs gene list analysis. System-wide profiling of genes and proteins in mammalian cells produce lists of differentially expressed genes / proteins that need to be further analyzed for their collective functions in order to extract new knowledge. Once unbiased lists of genes or proteins are generated from such experiments, these lists are used as input for computing enrichment with existing lists created from prior knowledge organized into gene-set libraries.
- Resource
- SciCrunch
- 13 years ago - by Anonymous
Glyco-CD
Manually curated, comprehensive repository of clusters of differentiation (CDs) which are a) defined as distinct oligosaccharide sequences as part of either glycoproteins and/or glycosphingolipids and b) defined as proteins which have carbohydrate recognition sites (CRDs) or as carbohydrate binding lectins. The data base is generated by exhaustive search of literature and other online data banks related to carbohydrates and proteins. This data bank is the beginning of an effort to provide concise, relevant information of carbohydrate-related CDs in a user- friendly manner. For users convenience the data bank under menu browse of GlycoCD is arranged in two section namely carbohydrate recognition CDs (CRD CD) and glycan CD. The carbohydrate recognition CD part is the collection of proteins which recognize glycan structures by means of the CRDs. Glycan CD is the part in which CDs are summarized which characterize specific oligosaccharide structures. The GlycoCD databank has been developed with the aim to assist the immunologist, cell biologist as well as the clinician who wants to keep up with the present knowledge in this field of glycobiology.
- Resource
- SciCrunch
- 14 years ago - by Anonymous
GlycoFragment
Service that calculates and displays the main fragments (Band C-, Z- and Y-, A- and X-ions) of oligosaccharides that should occur in MS-spectra. The extended ASCII nomenclature as recommended by IUPAC is used to input the sequence of complex oligosaccharides. However, some additional input rules have to be fulfilled. In case only the topology and composition of the oligosaccharide is known, a simpler way to input carbohydrate sequences is possible. Since the hydroxyl groups of synthetic carbohydrates are often the are protected they have included a way to indicate if sugar residue are persubstituted. Please have a look at the examples of valid input structures.
- Resource
- SciCrunch
- 14 years ago - by Anonymous
sumo
Service that searches carbohydrate structures for motifs commonly used for carbohydrate classification, like N- and O-glycan cores, Lewis antigens, etc. Note: Sumo is currently under construction. Motif searches are a frequently used tool in proteomics. For carbohydrate structures, there are also many motifs classified in the literature, e.g. the Lewis antigens or the diverse O-glycan core structures. Sumo is a tool to locate such motifs in a carbohydrate structure given in LINUCS or in IUPAC nomenclature., THIS RESOURCE IS NO LONGER IN SERVICE. Documented on September 16,2025.
- Resource
- SciCrunch
- 14 years ago - by Anonymous
LINUCS
Service that directly converts the commonly used extended representation of complex carbohydrates into the preferred canonical description or into its inverted form. Input: A structure using the extended, non-graphic nomenclature (in ASCII writing) to describe complex carbohydrates as recommended by IUPAC. Output: A linear, unique notation. The source code (written in C), will be distributed so that software developers can easily implement their algorithm within their own application. LINUCS was chosen to fulfill to following conditions: * Input of extended, non-graphic nomenclature to describe carbohydrate structures. * Resulting linear code is closely related to notations and abbreviations recommended by IUPAC. * Number of additional rules to define the priority of the branches is low * Extended nomenclature of complex carbohydrates contains all information to define the hierarchy. * LINUCS is applicable to all types of carbohydrates (macrocyclic system are currently not implemented) . * Remaining unassigned linkage information are tolerated
- Resource
- SciCrunch
- 14 years ago - by Anonymous
NetNGlyc
Server that predicts N-Glycosylation sites in human proteins using artificial neural networks that examine the sequence context of Asn-Xaa-Ser/Thr sequons. NetNGlyc 1.0 is also available as a stand-alone software package, with the same functionality as the service above. Ready-to-ship packages exist for the most common UNIX platforms.
- Resource
- SciCrunch
- 14 years ago - by Anonymous
GlySeq
Service dedicated to statistically analyze the sequences around glycosylation sites. Glycosylation belongs to the most common and most important co- and postranslational modifications of proteins. Since it is often difficult to determine which potential glycosylation sites are in fact glycosylated, there is only few data available about glycoproteins. Sources from which such data can be retrieved are SwissProt and the Protein Data Bank (PDB). Data from the PDB is obtained using pdb2linucs and updated weekly. GlySeq is dedicated to statistically analyze these sequences, especially the areas around glycosylation sites.
- Resource
- SciCrunch
- 14 years ago - by Anonymous
GlyTorsion
Service that performs a statistical analysis of carbohydrate torsion angles derived from the Protein Data Bank. Such as protein conformation can be described by the backbone torsion angles, a carbohydrate structure is mainly characterised by its linkage torsions. With the aid of pdb2linucs, a dataset of carbohydrate torsion angles was derived from from carbohydrate structures found in the PDB. This weekly updated dataset contains, besides linkage torsions, also ring torsions, omega torsions, N-acetyle group torsions and sidechain torsions of Asn residues involved in Glycan bonds. It can be queried by GlyTorsion.
- Resource
- SciCrunch
- 14 years ago - by Anonymous
GlyVicinity
Service to generate statistics about the amino acids present in the vicinity of carbohydrate residues. Besides the amino acids in sequential neighborhood of glycosylation sites (analysed by GlySeq), those in the spatial vicinity of carbohydrate residues determine the characteristics of glycoproteins. The latter ones are of special interest for the examination of carbohydrate-binding proteins. Since carbohydrate moieties are not covalently bound in these cases, sequence analysis comparable to that for glycosylation sites is not possible there. GlyVicinity performs statistical analyses on the types of amino acids around carbohydrate chains and on the atoms forming the closest contacts between protein and carbohydrate residues. Results are based on weekly updated datasets derived from the Protein Data Bank (PDB).
- Resource
- SciCrunch
- 14 years ago - by Anonymous
pdb2linucs
Service that automatically extracts carbohydrate information from pdb-files and displays it in LINUCS or IUPAC notation. Many pdb-files contain carbohydrate structures. Since there is not such a standard nomenclature like it exists for amino acids, it is difficult to find the carbohydrate information. Sometimes entire oligosaccharides are encoded in one single residue. Information about carbohydrate linkages is often missing, and if it is present, it is not in a unique format and therefore also difficult to find.
- Resource
- SciCrunch
- 14 years ago - by Anonymous
Colorado Assessment Tests - Repeat
THIS RESOURCE IS NO LONGER IN SERVICE, documented on July 17, 2013. This free neuropsychological evaluation software, Repeat, examines performance on a serial reaction time task thought to depend upon implicit memory. Participant's acquisition of a repeating stimulus sequence is assessed in this task. Repeat is a modification of procedures reported by Nissen and Bullemer (1987) and by Lewick, Hill and Bizot (1988). The computer screen is divided into quadrants. A single X, appears in one of the quadrants. The participant's task is either, depending on response modality, to strike as quickly as possible the key (4, 5, 1, 2 on the numeric keypad) corresponding to the quadrant in which the X appears or to position the mouse pointer over the quadrant and click it. The X then appears according to a repeating pre-programmed sequence in a different quadrant and the participant is required to respond as quickly as possible to that X. A trial is made up of a series of the repeating sequence. Sequence order and length and the number of iterations of the sequence are predetermined by the experimenter. CATs Repeat also allows for the interleaving of a randomly positioned X between each sequenced X. Alternatively a series of random presentations can be programmed to allow for assessment of the baseline speed of responding, that is a condition under which the participant can acquire no anticipatory information to enhance speed of responding. Repeat also contains a dual-task or split attention component modeled after a task reported by Nissen and Bullemer (1987). This task is identical to the one described above except that either a low or high tone is presented with each X presentation and the participant is asked to count the number of low tones they heard during a trial. The relative frequency of low tones is experimenter definable. Finally Repeat allows for the assessment of the explicit knowledge the participant may have acquired of the sequence. This component of the task is modeled after the generate procedure reported by Nissen and Bullemer (1987). At any point in the experiment the participant can be asked to begin predicting where the X will appear next. At this time no normative data is available for this test.
- Resource
- SciCrunch
- 17 years ago - by Anonymous
The Biomedical Research Foundation - Current Research
THIS RESOURCE IS NO LONGER IN SERVICE, documented August 23, 2016. This laboratory facilities contain core research space for monoclonal antibody production, oligonucleotide and peptide synthesis, gene cloning, DNA sequencing, high performance liquid chromatography, tissue culture, positron emission tomography, magnetic resonance spectroscopy and electron microscopy.
- Resource
- SciCrunch
- 17 years ago - by Anonymous
About
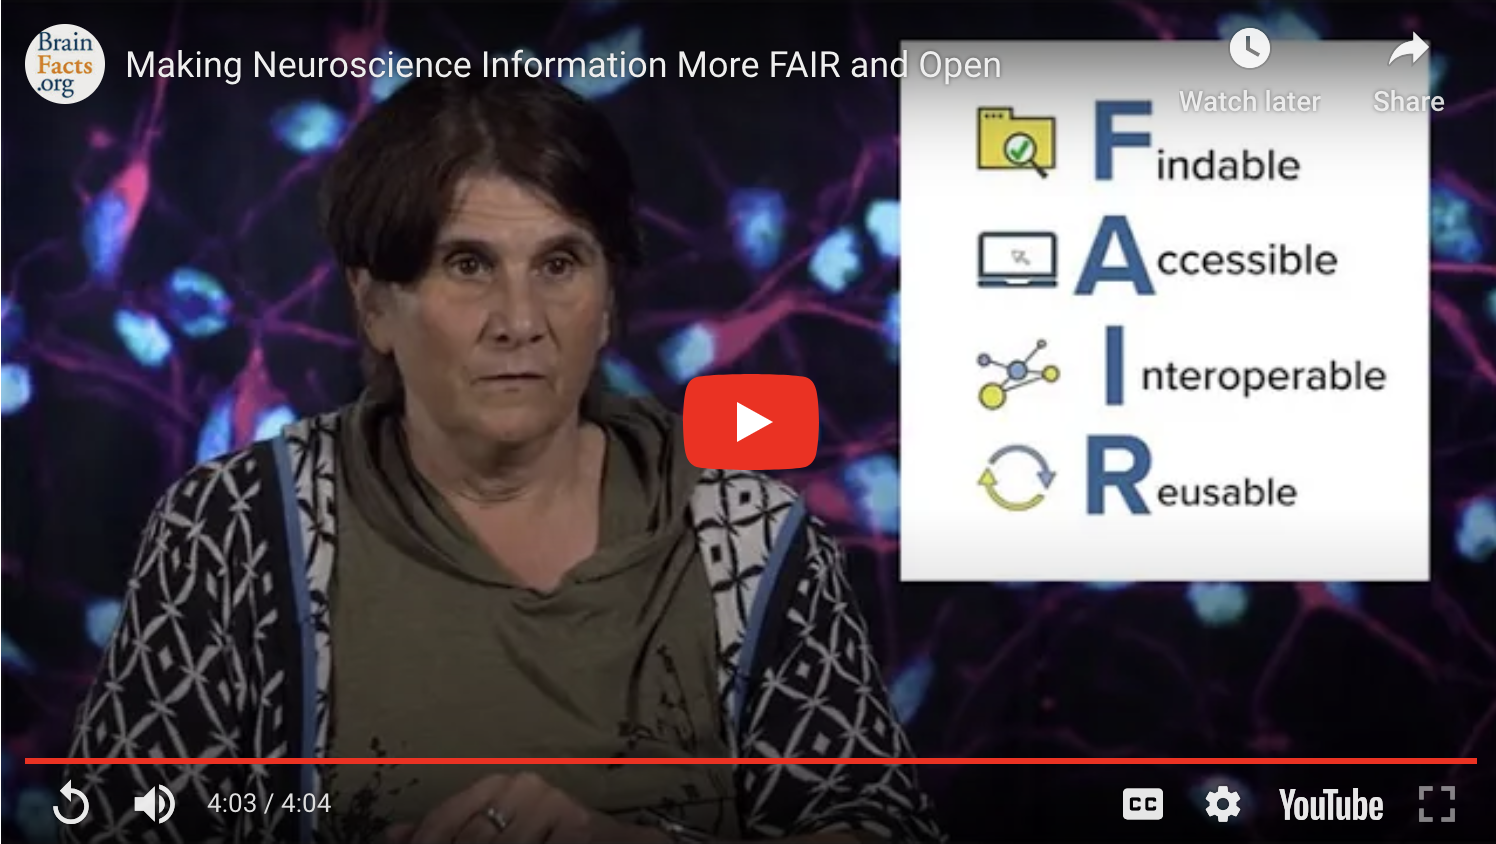
The SciCrunch Infrastructure was developed as a cooperative data platform to be used by diverse communities in making data more FAIR.
Contact Us
 scicrunch.org